
Skip to content

CropsSoybeans

Soybean scouting before the canopy closes

Soybeans hide their problems once the rows close, so PropelMapper keeps the May stand check, the July aphid counts and the August white mold notes pinned to the spot where you made each one.

Pod count - Marcy Quarter with its saved structured readings.
Example account: Prairie Agronomy.

Soybeans note and report

Pod count - Marcy QuarterSep 5, 2026

“Pod count 38 per plant on 10 plants, 3 beans per pod average.”

Example account: Prairie Agronomy

Visual example; transcript only.

Details in the noteFor review with the visit
  • Pods per plant 38
  • Plants sampled 10
  • Beans per pod 3 average

Prairie Agronomy

Pod count - Marcy Quarter

Ortega Ridge › Marcy Quarter (Soybeans)
Visit Sep 5, 2026 Version 1 · English
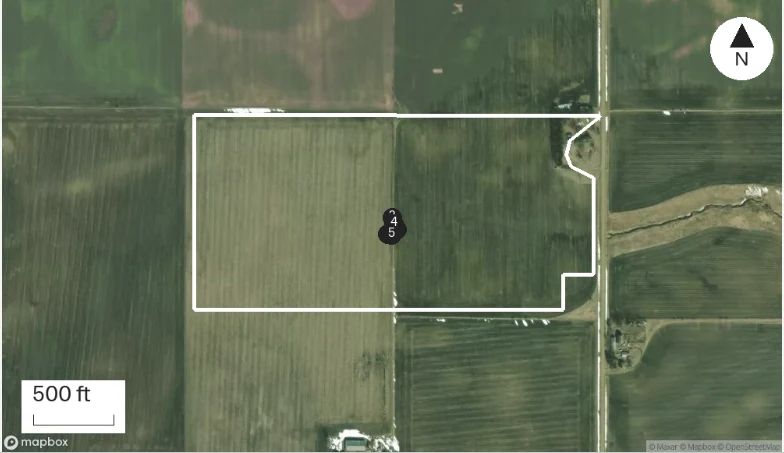
Marcy Quarter (Soybeans): captured report map with numbered observation pins and the saved boundary.
Numbered pins: visit captures · Dashed line: walked path · Basemap: Mapbox satellite. Imagery date not stated.

At a glance

  1. Pod count 38 per plant on 10 plants, 3 beans per pod average.

  2. Soybean aphids averaging 80 per plant, below threshold, recheck in 7 days.

  3. Frogeye leaf spot moderate on upper canopy in the south end.
Sources

  • Recorded on Sep 5, 2026 at Marcy Quarter (Soybeans).

Pod count - Marcy Quarter, Sep 5, 2026: “Pod count 38 per plant on 10 plants, 3 beans per pod average.” The visit form gets Pods per plant 38, Plants sampled 10, Beans per pod 3 average, and the report lists them under Pod count - Marcy Quarter.

Example voice note and reviewed report

Soybeans visits on the map

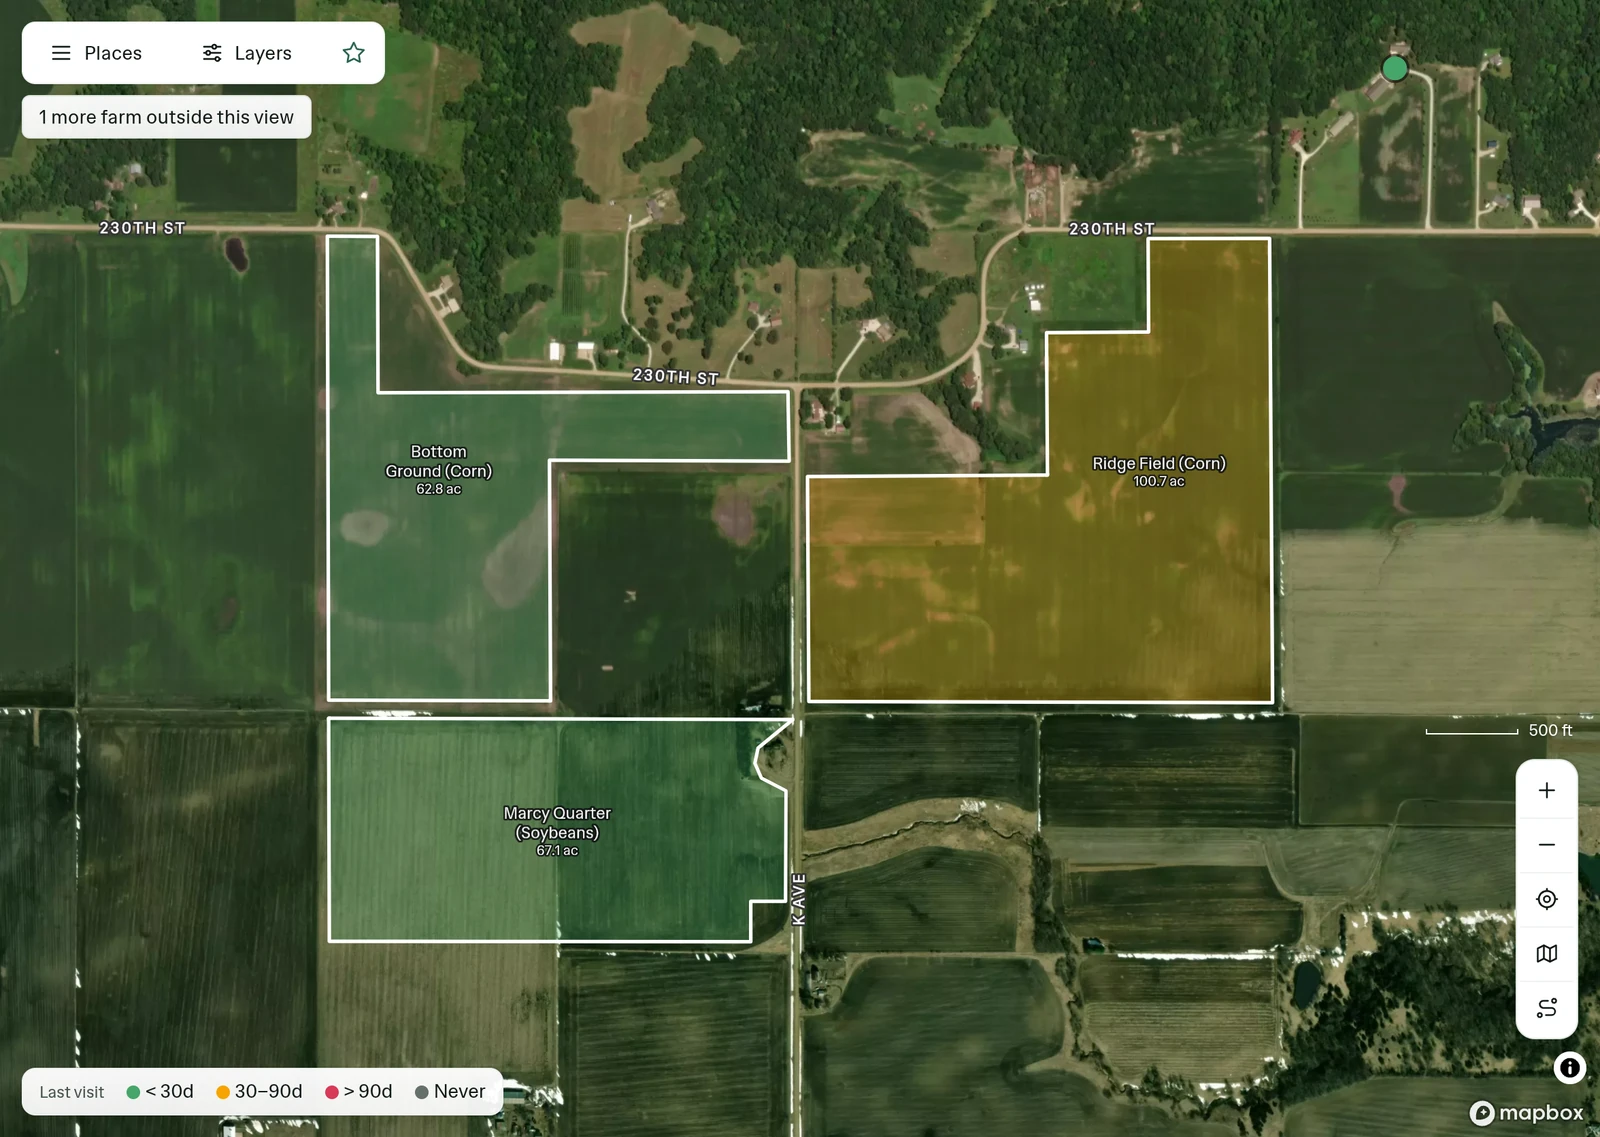
Prairie Agronomy on the Map: places outlined on satellite and colored by last visit.
Example account: Prairie Agronomy. Ortega Ridge outlined on satellite and colored by last visit.

Soybeans places and hierarchy

Farm: Ortega Ridge → Field: Marcy Quarter (Soybeans)

Saved places for Marcy Quarter (Soybeans).
Ortega Ridge in the Prairie Agronomy place list, with its last visit and report status.

Soybeans signed report excerpt

Signed Pod count - Marcy Quarter findings for Marcy Quarter (Soybeans).
Example account: Prairie Agronomy. Excerpt from the signed report for Marcy Quarter (Soybeans).
A woman taking a photo with her phone beside a fence and a scrub-covered field.
Soybeans · field guide
Stages
Nodes, then bloom to maturity
CDL class
5 · Soybeans
Scouting
Stand check through full seed

Stages follow the V and R system described by University of Minnesota Extension. Acreage on this page is from the USDA Cropland Data Layer for 2025.

A woman taking a photo with her phone beside a fence and a scrub-covered field.
The walk

Field checks

Five soybean checks by growth stage

Soybeans make up for a thin stand better than corn does, by branching and setting more pods. That makes the stand check less about one number and more about gaps, timing and what else the field is telling you.

  1. Stand check

    VC to V2

    Iowa State measures one thousandth of an acre (17 feet 5 inches of 30-inch row) or tosses a hoop and multiplies by a factor. Replant usually comes up below about 75,000 plants an acre for early plantings, or 50,000 to 60,000 for plantings in late May and June. Note the gaps, not just the average.

    Record: Plants per acre, method, gap lengths

  2. Weeds and early insects

    V2 to R1

    Escapes after the post pass, by species and height, each with a pin. Bean leaf beetle feeding on young plants, and how much leaf area is gone.

    Record: Species, height, patch size, defoliation

  3. Soybean aphid

    R1 to R5

    The University of Minnesota threshold through R5 needs all three: an average of 250 aphids per plant, more than 80 percent of plants infested, and numbers rising. Count whole plants across the field, away from borders and hot spots.

    Record: Aphids per plant, plants checked, percent infested, change since the last visit

  4. White mold and stem disease

    Flowering in cool, wet weeks

    A closed canopy and cool, wet weather at flowering set up white mold. Split stems, look for white growth and black sclerotia, and note where in the field you found them.

    Record: Plants affected out of plants checked, location

  5. Pod fill

    R5 to R6

    Pods per plant and seeds per pod for a yield estimate, plus late disease and defoliation.

    Record: Pods per plant, seeds per pod, plants counted

Thresholds come from extension guidance and get revised. Check your state’s current numbers before acting on one.

Where it grows

Where soybeans are grown

About 77 million acres were classified as soybeans in the 2025 Cropland Data Layer. Illinois and Iowa together hold about a quarter of them.

  1. Illinois9.8 million acres
  2. Iowa9.5 million acres
  3. Minnesota7.1 million acres
  4. North Dakota6.5 million acres
  5. Indiana5.3 million acres
  6. Missouri5.1 million acres
77.0 million acres across the 48 states in our snapshot, 2025. These are single-crop soybean acres classified from satellite imagery, not NASS planted-acreage estimates. Double-crop wheat and soybeans is a separate class. Class 5 acres from the USDA NASS Cropland Data Layer, retrieved October 16, 2026.
Report out

The inspection question

Soybean aphid counts and method

The aphid threshold is an average per plant, and the average depends on how many plants you looked at and where. The plants by the buckthorn on the field edge give a different average than plants spread across the field. Say the count and how you got it.

In PropelMapper each stop is a pinned note. Say "twenty plants, about one-ninety a plant, eighteen of twenty infested" and the readings land in the visit form for you to confirm. Next week’s count goes in the same column of the Metrics grid, so the rising-or-falling part of the threshold is right there.

Your report gives the grower the count, the method and your call. If the call is to wait and recount in a few days, that becomes a task with a date on it.

Soybean rotation, NDVI and soil pH maps

The layers are most useful for choosing where to walk and for explaining a pattern you already found on foot.

  • Crop historyUSDA NASS Cropland Data Layer

    • Soybeans class 5
    • Double crop winter wheat and soybeans class 26

    Eight years of crop history make the corn and soybean rotation easy to see, and so is the year somebody broke it. Double-crop wheat and soybeans has its own class.

  • NDVICopernicus Sentinel-2 L2A

    Field mean, minimum and maximum

    Before the canopy closes, NDVI mostly sees the soil between rows. It earns its keep in July and August, when a low patch can point you toward something worth walking to.

  • SoilUSDA NRCS SSURGO

    map units, by share of the field

    Iron deficiency chlorosis tends to follow high-pH soils, and the soil survey shows where those map units fall in the field.

Crop history NDVI Soil maps Field maps and layer sources

Who scouts soybeans

Questions

Soybean scouting questions

Is a hoop count as good as a row count?

Both are on Iowa State’s list. A hoop suits narrow rows and drilled beans; a measured row length suits wide rows. Write down which one you used and its multiplier.

When does the aphid threshold stop applying?

University of Minnesota’s published threshold runs through beginning seed. After that, it gives no formal threshold.

Do I need signal in the field?

No. The phone keeps notes, photos and counts without a connection and sends them when you are back in range.

Soybean stand and aphid counts by field

Keep the stand check and the aphid counts on the same field, and the season explains itself when the grower asks about yield.

What do you write up after a visit?

Pick one and see the signed report PropelMapper drafts for it.