

ProductMetrics
Field readings collected into one sortable grid
PropelMapper pulls the readings out of what you say and type on a visit, asks you to confirm them, and files every reading in a metrics grid where every place is a row, every reading is a column, and every cell remembers where it came from.

Stand count from a voice note
Marcus is walking Home Place at 11:13. He has done three 1/1000 acre checks and he says it the way he would say it to the grower: stand count about 32,400 plants an acre across three checks, emergence fairly even. Then he walks on.
When the visit uploads, PropelMapper finds the number in the recording and puts it under the visit's Structured data as a stand count of 32,400, marked as proposed, next to a Confirm button. Marcus checks it against what he said and confirms it. Now it is a reading, not a sentence.
That reading lands in Metrics, in the Home Place row, in the Stand count column, dated September 19. Next June's count lands in the same cell, and the old one moves into its history. Nobody copied anything into a spreadsheet, and nobody will need to.
Readings: what you said and what the report says
The stand count Marcus said at Home Place, and where it ends up.
“Stand count, about 32,400 plants an acre across three thousandth-acre checks. Emergence fairly even.”
Prairie Agronomy
Readings - Home Place
Home Place (Corn)
At a glance
Stand count: 32,400 plants/ac (three 1/1000 ac checks). Emergence fairly even.
Observations
Stand count: 32,400 plants/ac (three 1/1000 ac checks). Emergence fairly even.
After your review
Example account: Prairie Agronomy
Readings grid by place and metric
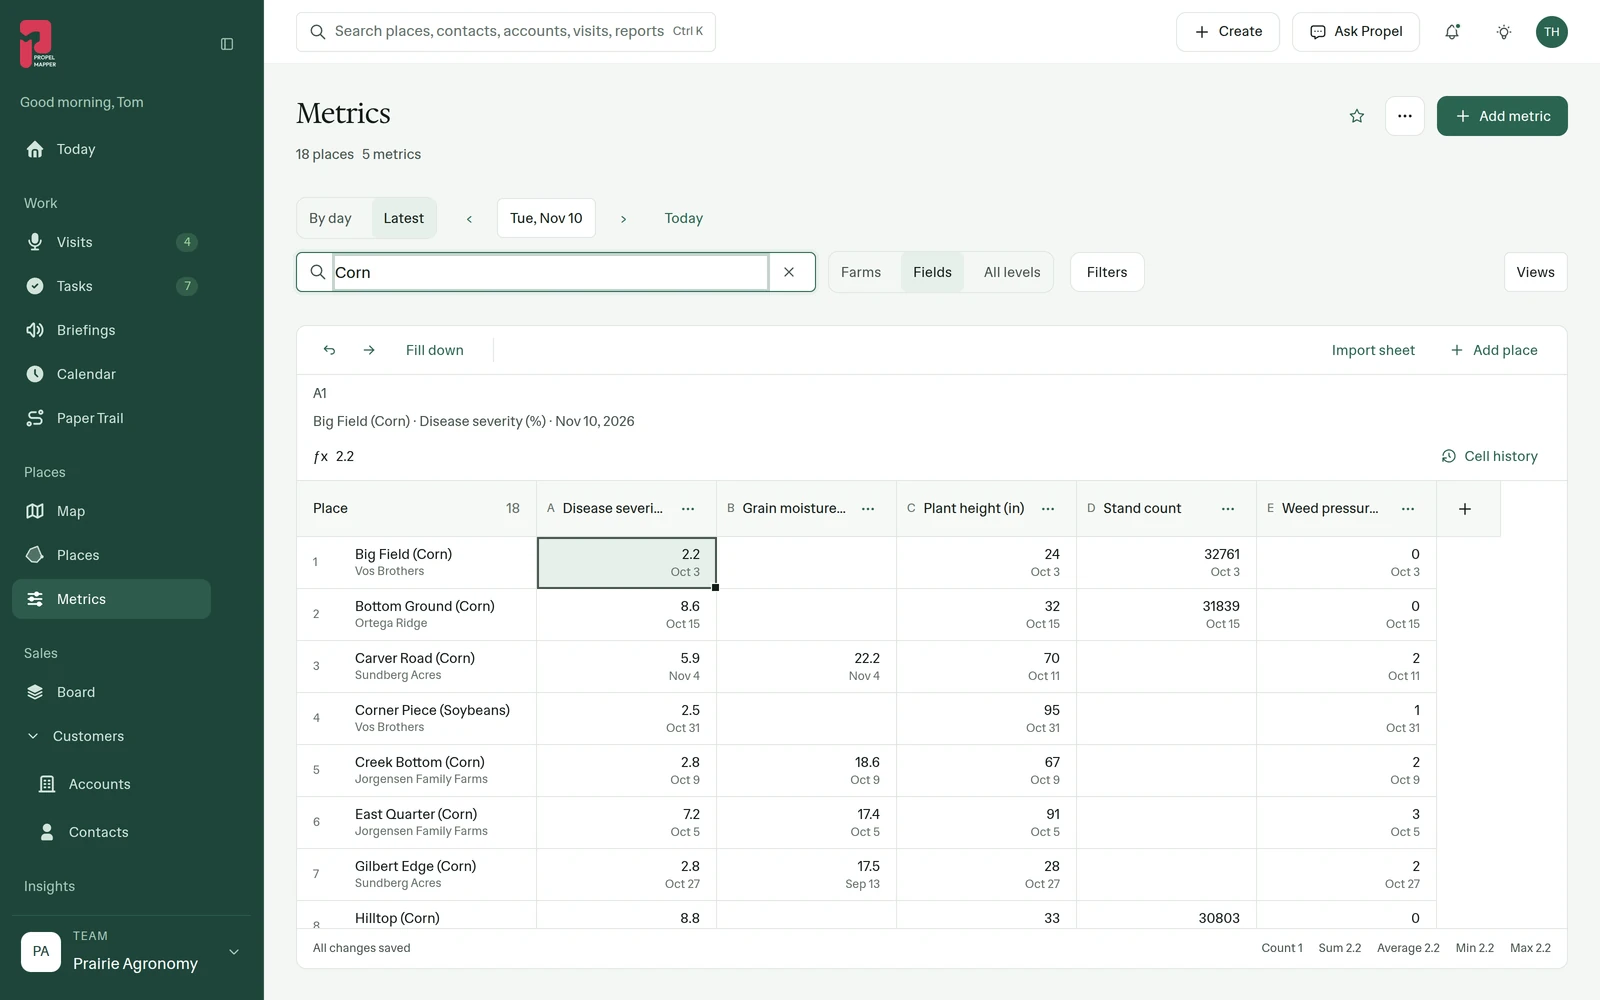
We built Metrics to look like a spreadsheet on purpose. Rows are places, at whatever level you choose: farms, fields or all levels. Columns are the readings your team records: aphids per plant, average daily gain, body condition score, buildings inspected, clinical mastitis cases, stand count. Pick a reading window to narrow the dates.
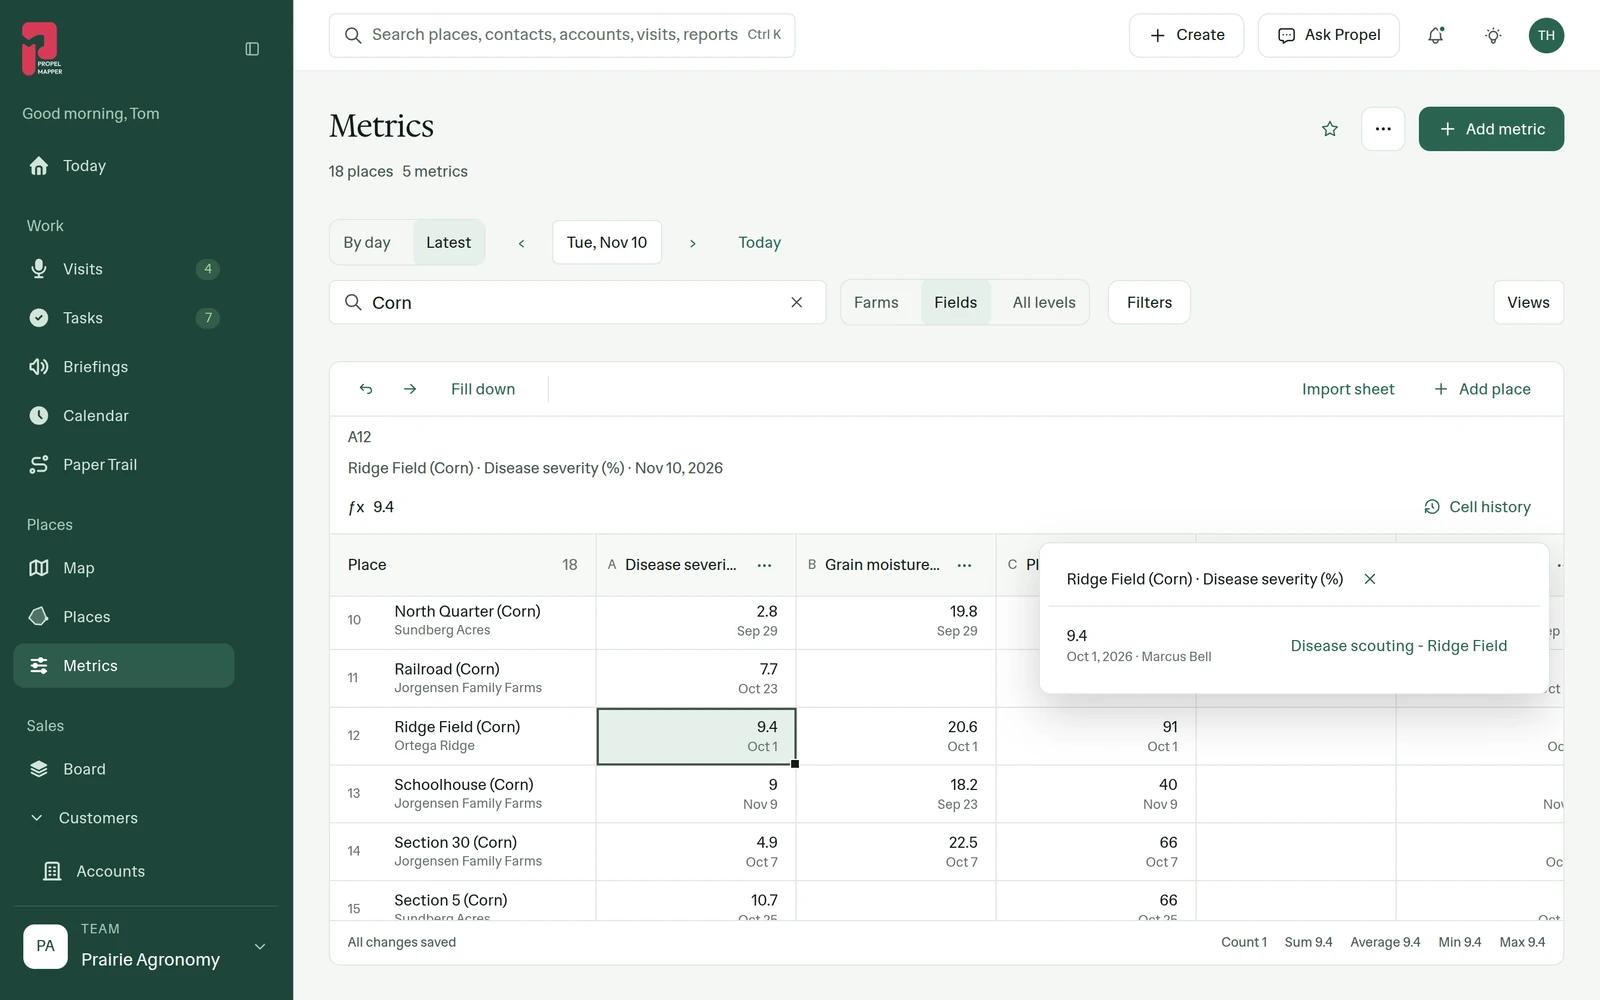
Click a cell and the formula bar shows its value, or the formula if it is a calculated column. Open its history and you see every reading for that place, newest first, each one linked to the visit it came from. That link is the point. A number you cannot trace back to a walk is a number you cannot defend to a grower or a lender.
Type a value straight into a cell when a reading arrives some other way. If it is outside the range set for that metric, PropelMapper says so and lets you save it anyway if the reading is right. Save the arrangement you use most as a view, and it is there next time.
Metric names your team uses
Metric types live in Settings. Each one is a reading your team records, sorted into groups. Some advisors say stand, others say population, others say plant count. Setting the type up once means they all land in the same column instead of three.
Checklists in Settings draw on the same metric types, so a reading asked for on a pre-visit checklist and a reading spoken in a voice note end up in one place.
Metrics map layer and export
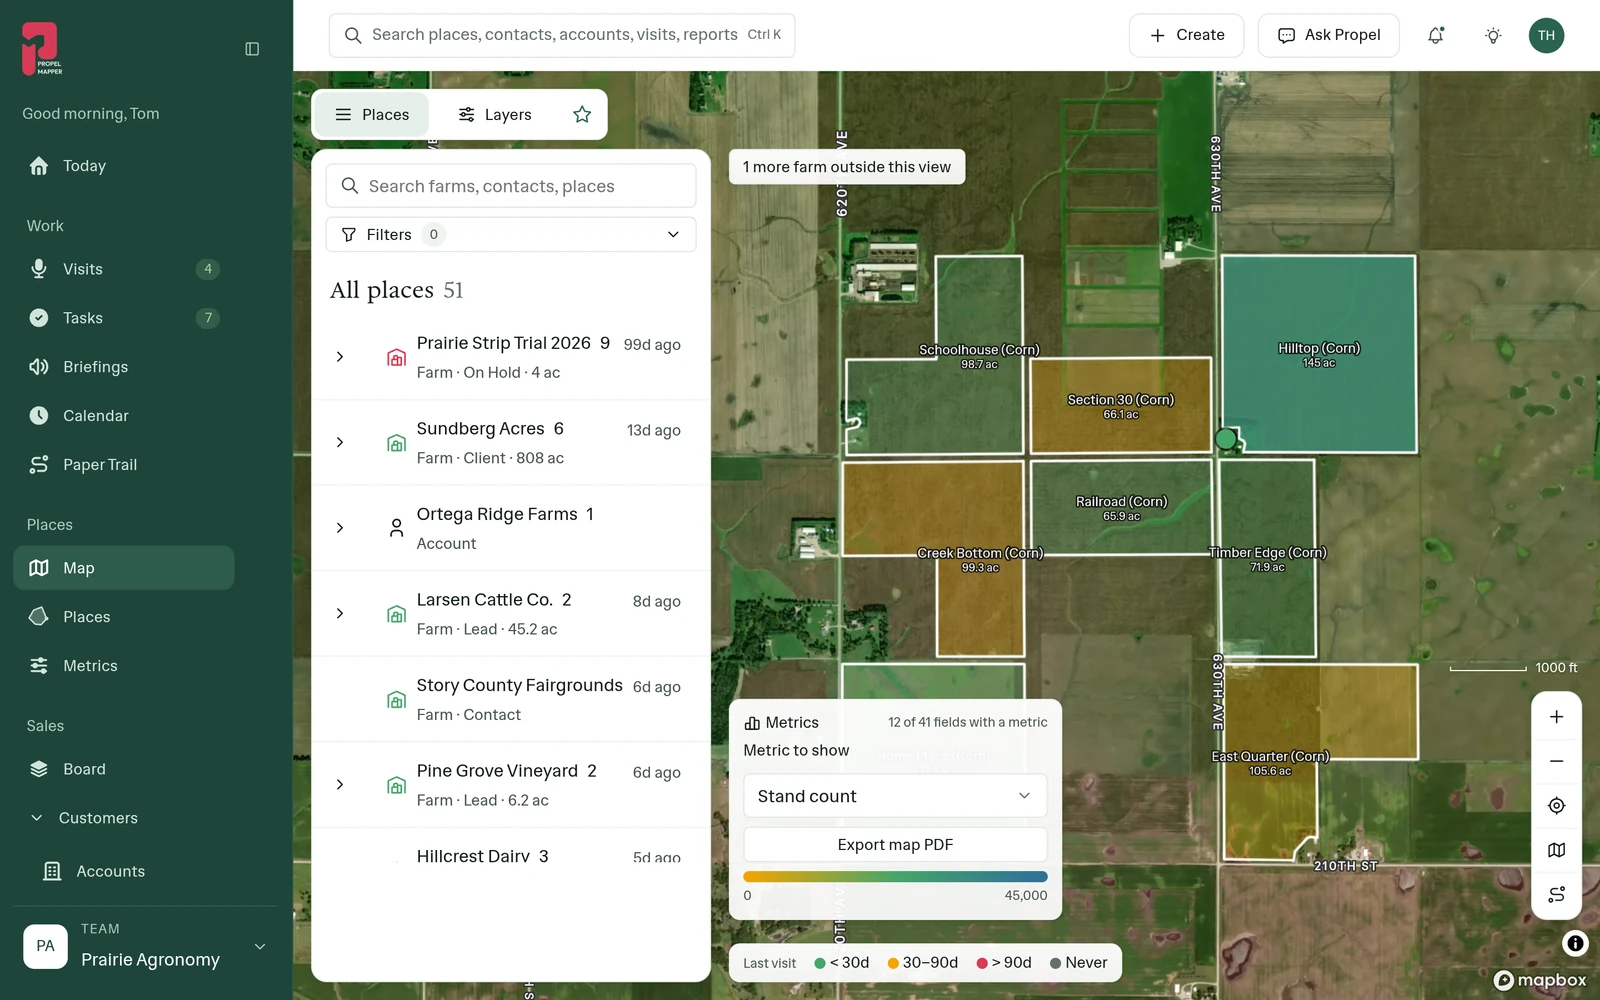
The Metrics layer on the map colors each field by the reading you pick, with its own legend, and exports as a PDF map. A whole farm of stand counts on a single map starts a conversation with a grower that a table never does.
Export the grid as CSV or Excel whenever you want, exactly as filtered. Research teams take it to their stats package. Team leads save the view they use for the season review, so the same columns and places open each time, next to the Insights dashboard. Either way the numbers are the ones advisors confirmed in the field.
In the app
Example account: Prairie Agronomy
Example account: Prairie Agronomy
Questions about metrics
Does PropelMapper make up readings?
No. It proposes a reading only when it hears or reads that reading in your captures, and it waits for you to confirm it. You can also type a reading directly.
Can I add a calculated column?
Yes. A cell can hold a formula, and calculated metrics sit in the grid next to recorded ones.
Who it’s for
Agronomists and farm managers who want readings they can compare across a season, research and extension teams running trials, and dairy and livestock advisors tracking scores herd by herd.