
ProductMaps
Field maps with your visit notes attached
In PropelMapper your saved fields, photos and voice notes share one map, so you can find the place you inspected and return to the observation.

Returning to a mapped field stop
The grower calls about the outlet you photographed on your last walk. You open Schoolhouse and select that stop on the visit map. The photo and recording show what you saw there, before you head out to look again.
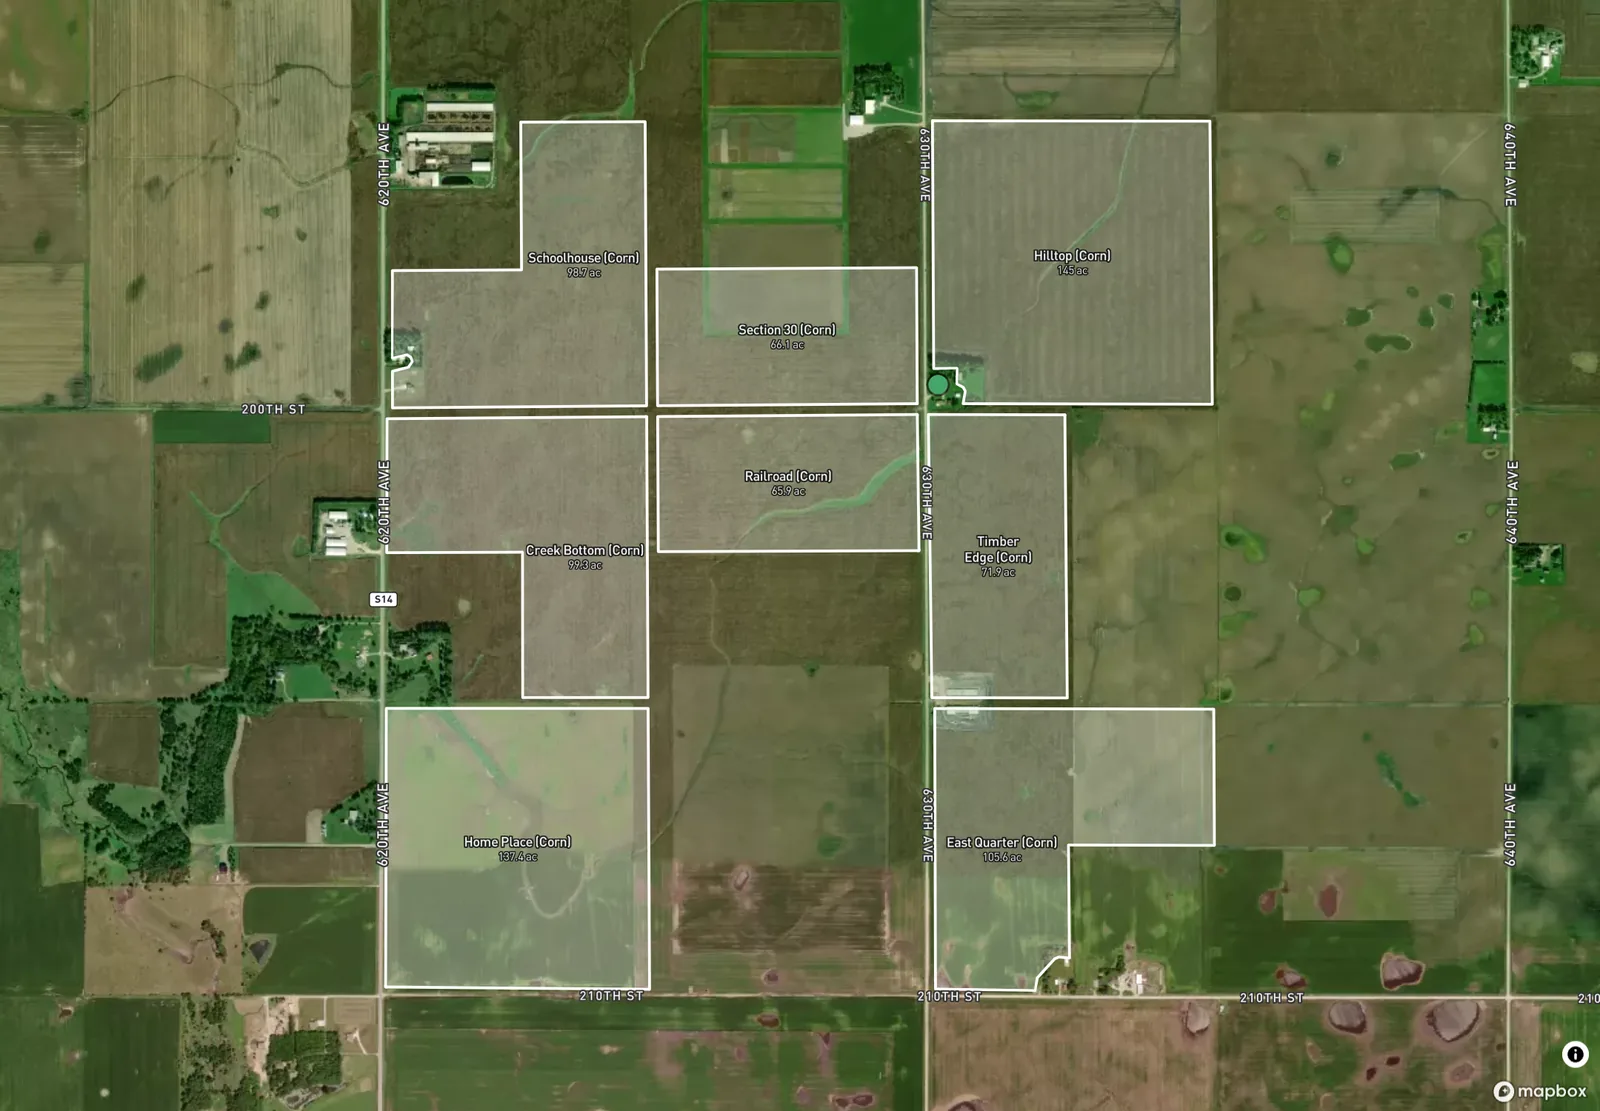
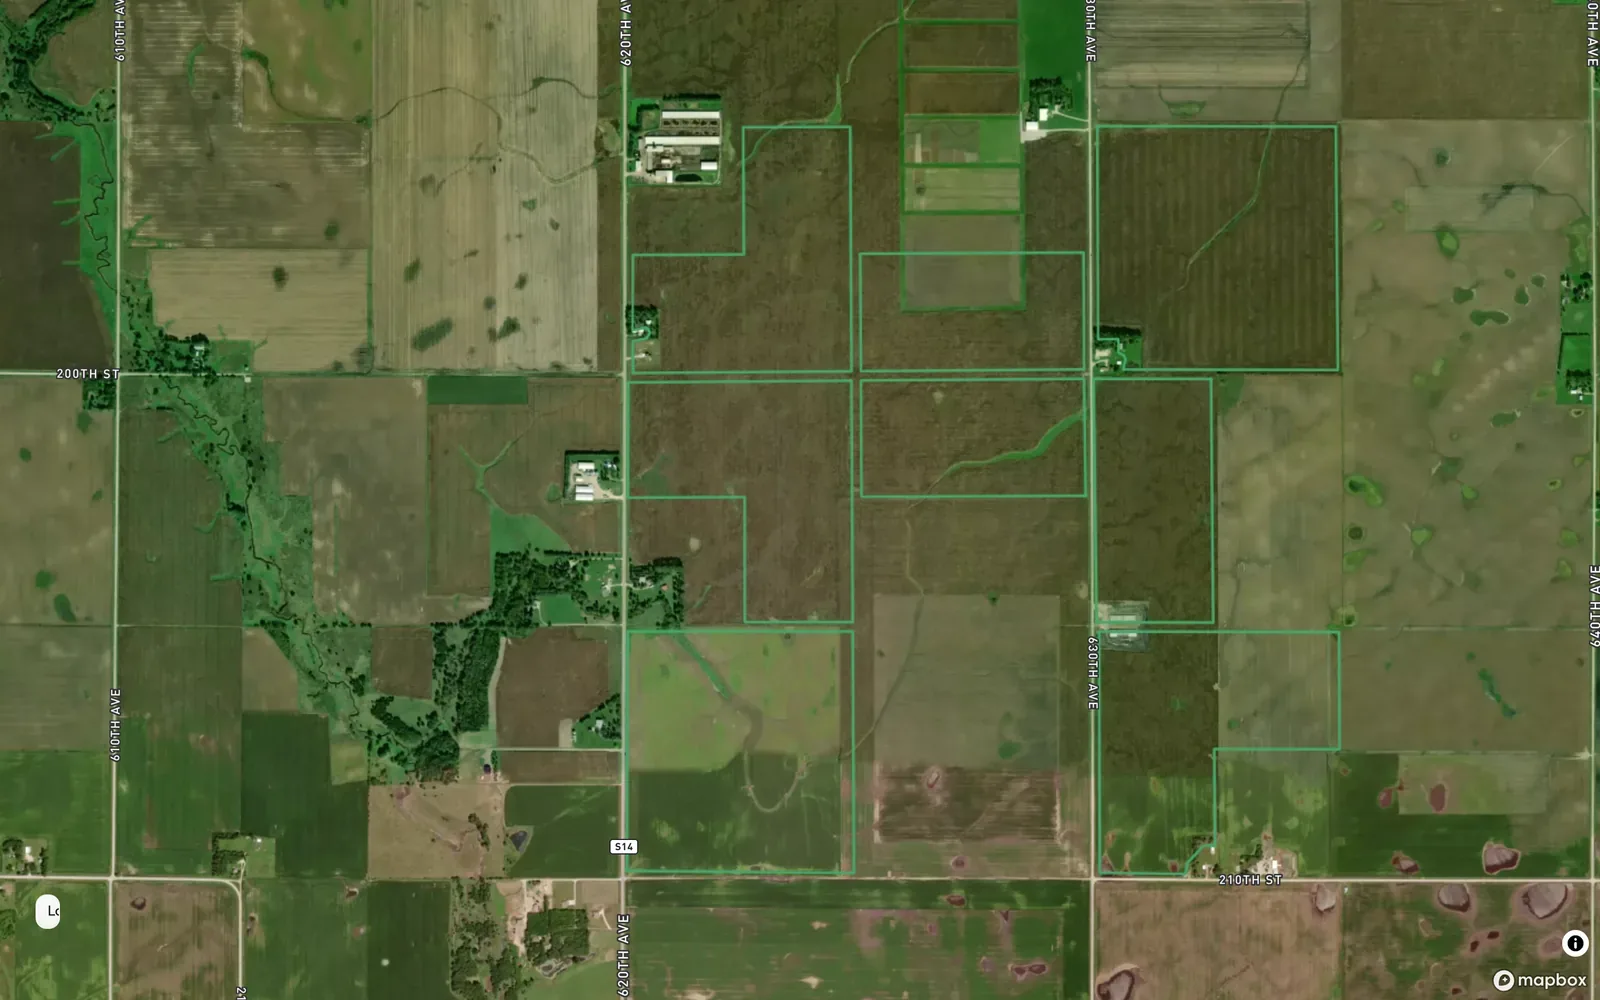
Your team saves the field boundaries it uses: drawn or walked on the phone, or imported in the browser from shapefile, KML, KMZ or GeoJSON. At a shared gate you can change the nearby field the phone suggests. Those outlines locate the work.
On the next walk you record a fresh photo and say what has changed. The visit keeps the stops in order with their locations.
Each layer shows you where to look. What you see and record on the visit is the finding, and the report keeps the two apart.
Return to the tile outlet: what you said and what the report says
“Schoolhouse, back at the tile outlet. This is the spot in the photo from the previous visit. There is still standing water beside the opening. I saved another photo from here.”
Return to the tile outlet - Schoolhouse
At a glance
The tile outlet was revisited at the location saved during the previous visit. Standing water was visible beside the opening.
A new photo was saved for comparison with the earlier visit.
Observations
The tile outlet was revisited at the location saved during the previous visit. Standing water was visible beside the opening.
A new photo was saved for comparison with the earlier visit.
After your review
Example account: Prairie Agronomy
Every layer on one map
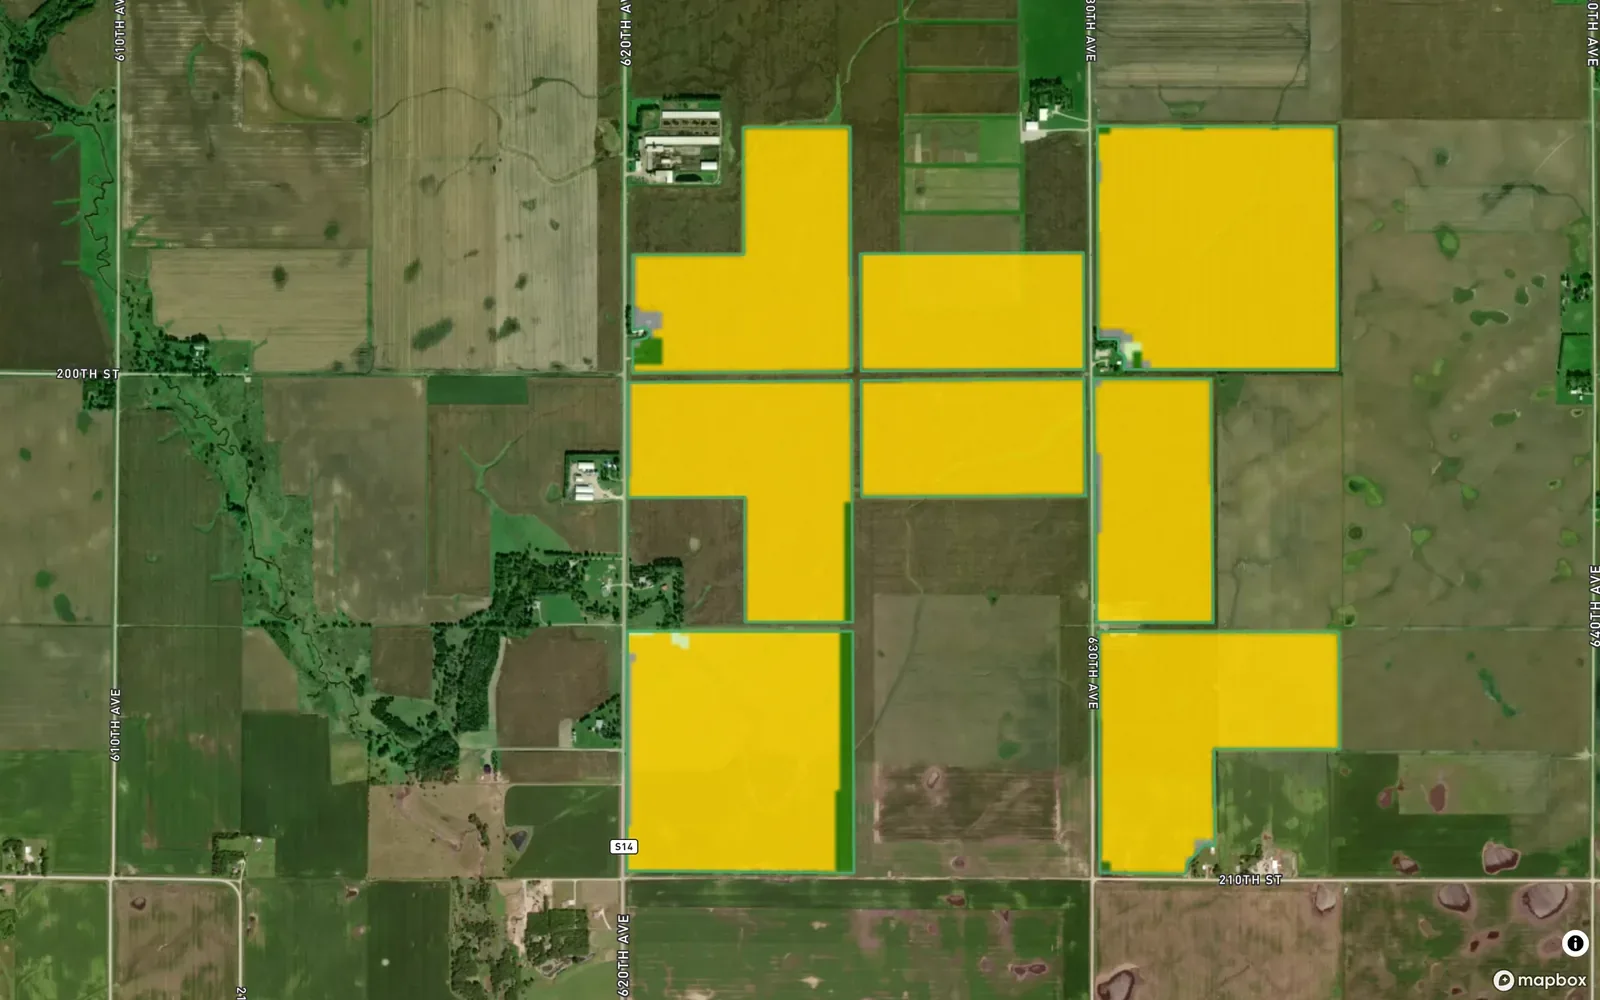
The map has two kinds of layer. Your own: field boundaries, places colored by how long since the last visit, the pins from every capture, a heat map of where the team recorded its captures, today's route and the area you can reach in half an hour or an hour. And reference layers for the ground itself: the soil survey, eight years of crop history, NDVI from Sentinel-2, and elevation with hillshade and contours.
Reference layers are clipped to your field boundaries, so the soil map shows the soils inside the field you drew and not the whole county. Each layer has its own page with its source, its date and what it can and cannot tell you.
The field boundary and the observation location
A useful farm map answers two different questions: which ground belongs to this visit, and where you made each observation. The saved field boundary identifies the place. The visit’s observation locations explain individual stops. Together with the photos and notes, they let another advisor understand the work without relying on a field nickname alone.
Check the outline against the ground you intend to discuss. An imported boundary may include a different area from the field the grower names at the gate. A lane, waterway or neighboring parcel can change the area represented by a map layer. Keep that distinction clear before interpreting a field average or writing about the whole field.
A phone location helps you find a stop again, but the observation still needs words. Describe the outlet, row, entrance or visible landmark when it helps the next person. A close photograph of a damaged plant may show the detail well while giving little clue about which part of the field contains it.
If you return after a repair or a change in conditions, make a fresh visit record. The earlier pin shows where the earlier observation was made. The new photo and note describe what you found today. The report can then explain what changed, using dates and locations the client can follow.
Choosing map layers for the question at hand
Before a scouting round, a dated satellite image may help you choose a patch to inspect. A US soil survey may suggest a question about the soils mapped beneath it. Crop classifications may raise a question about earlier land use. These layers provide context for the walk, and each describes a different source and period.
Saved maps can accompany you offline. New layers need a connection, and US soil and crop-history coverage does not extend to every farm worldwide. Our data-sources page explains those sources. For the client’s report, select the map that supports the finding and explain why that location matters to the proposed next step.
In the app


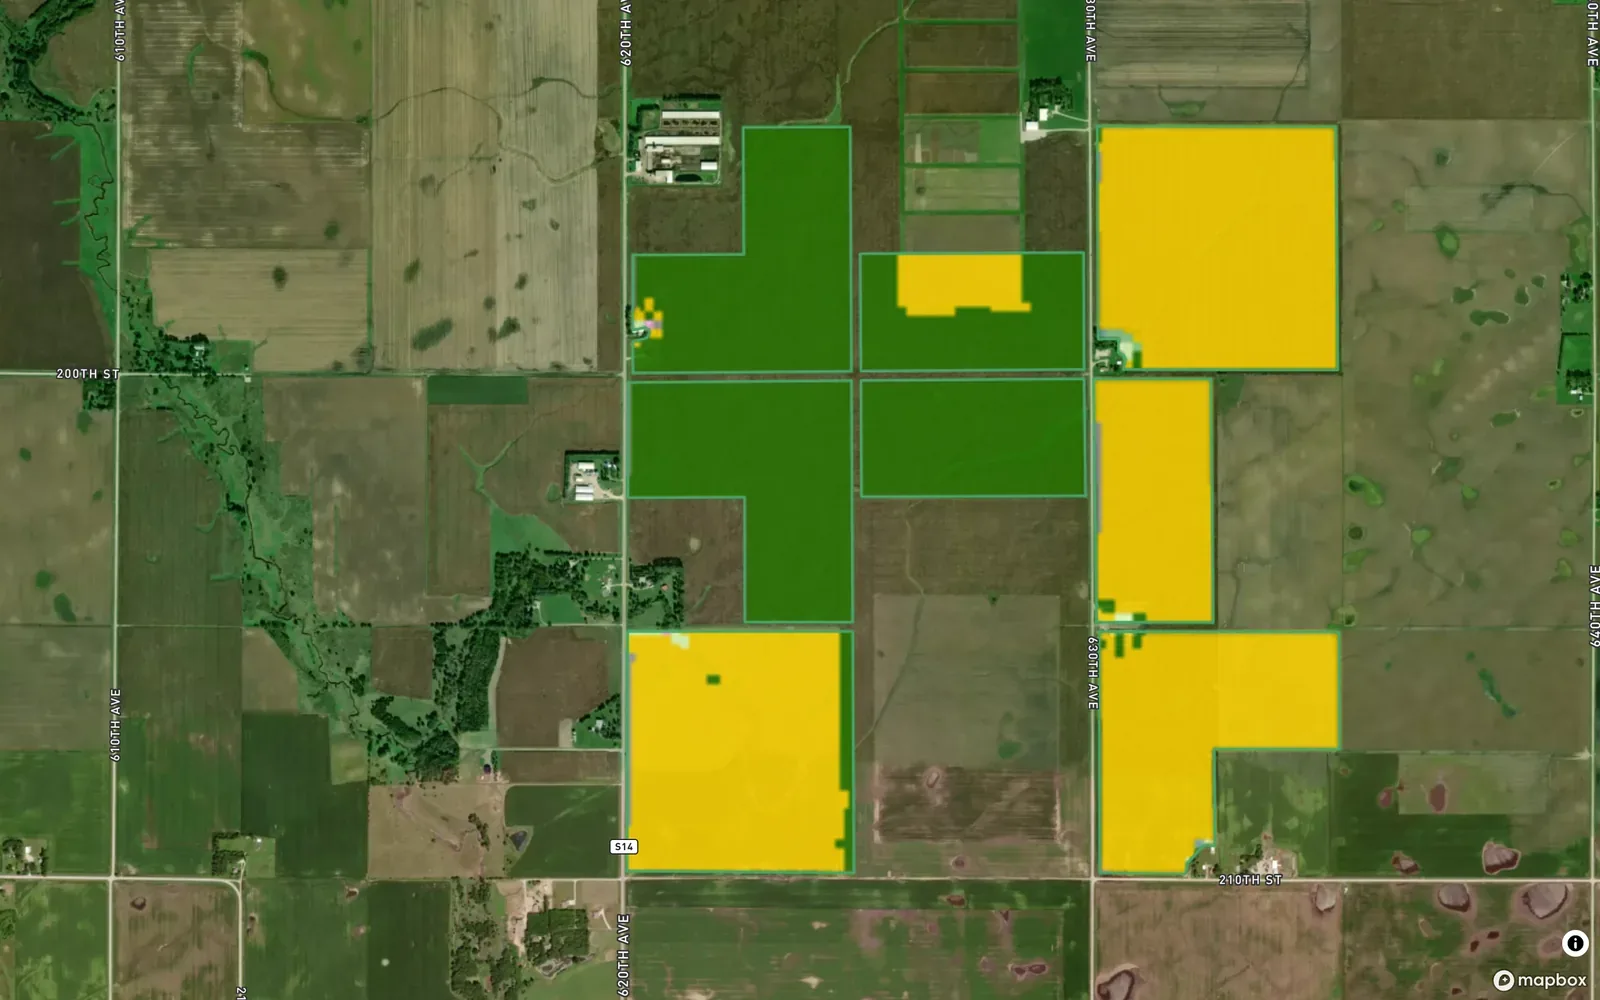
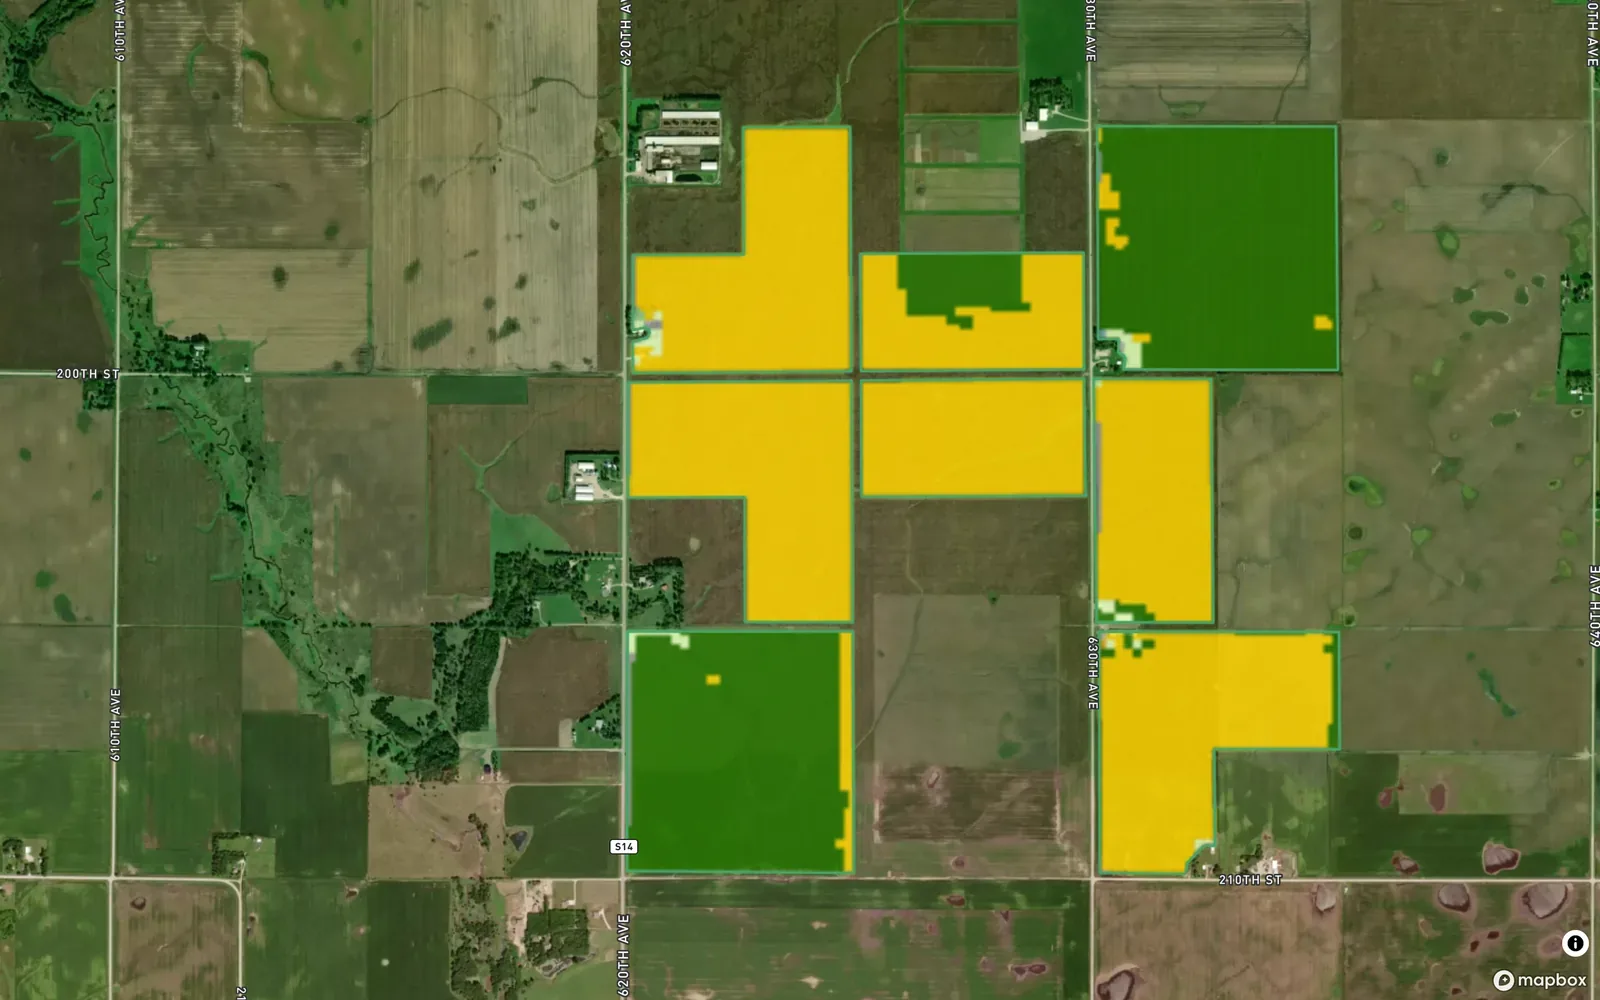
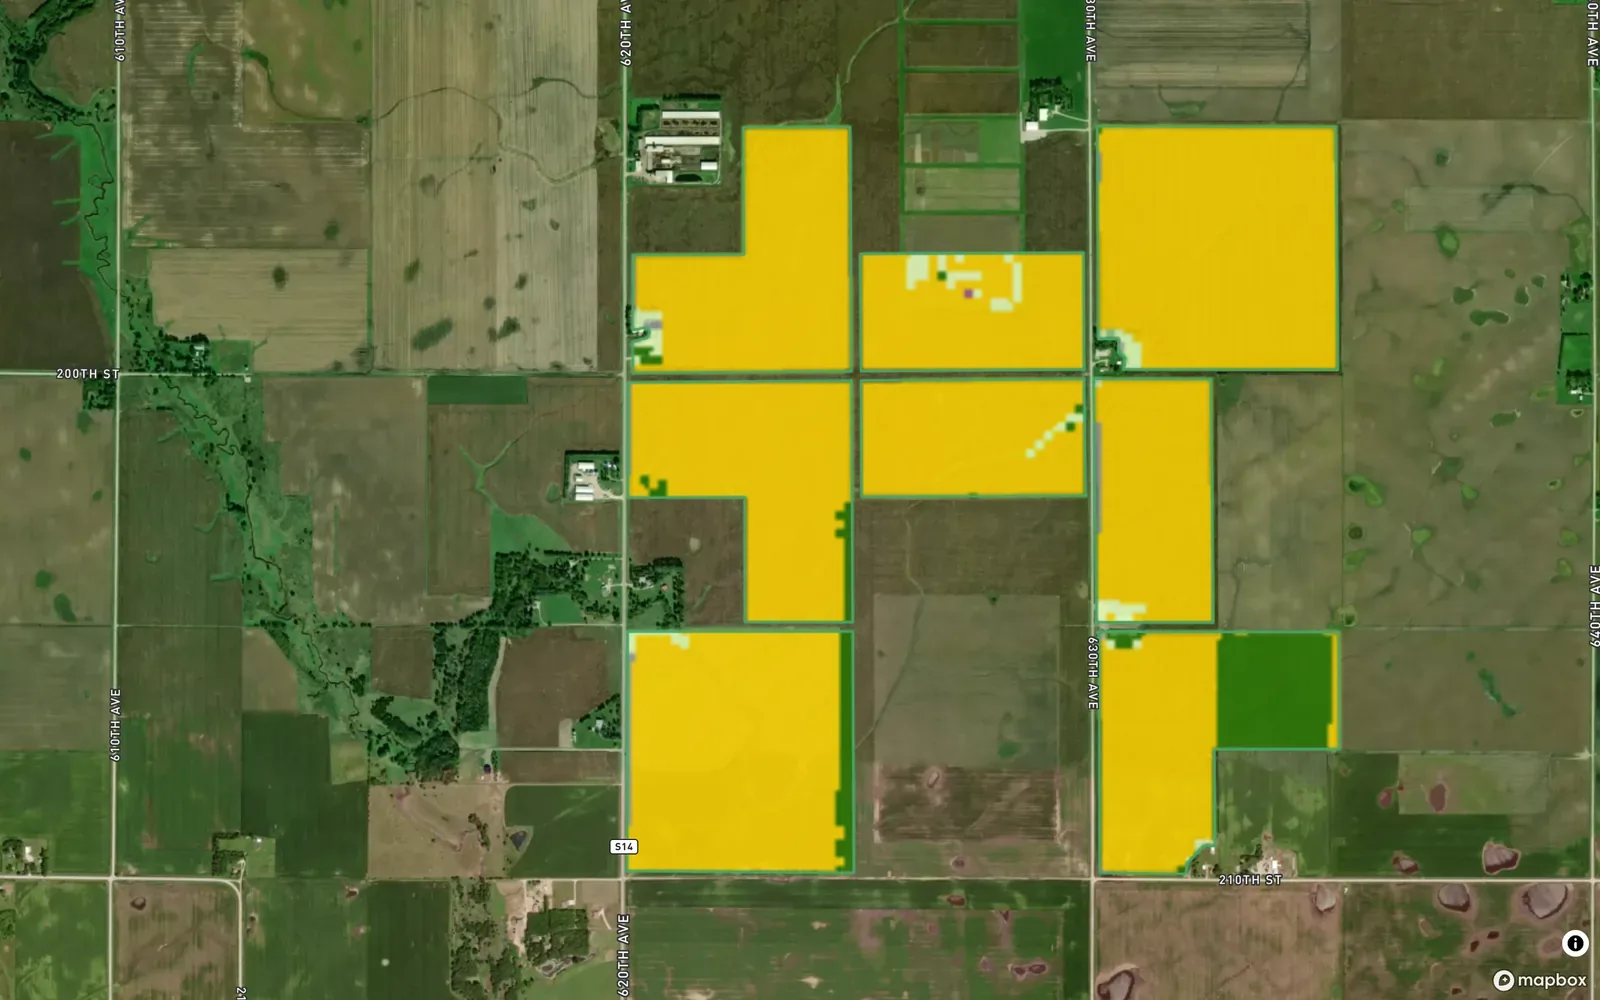
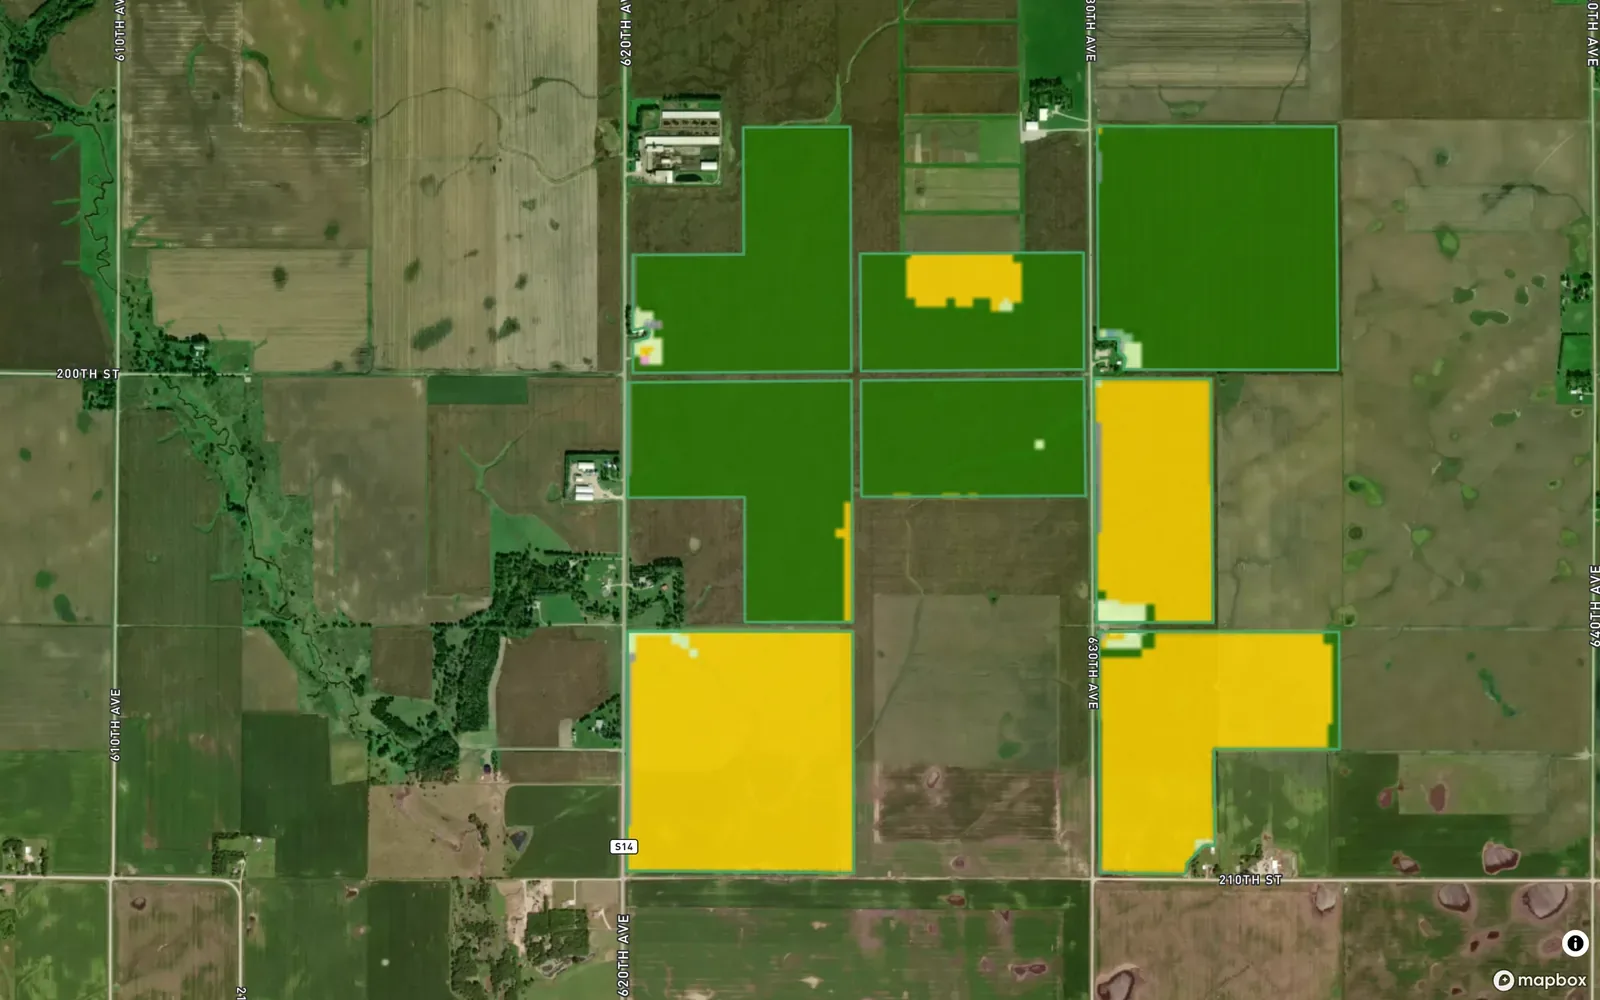
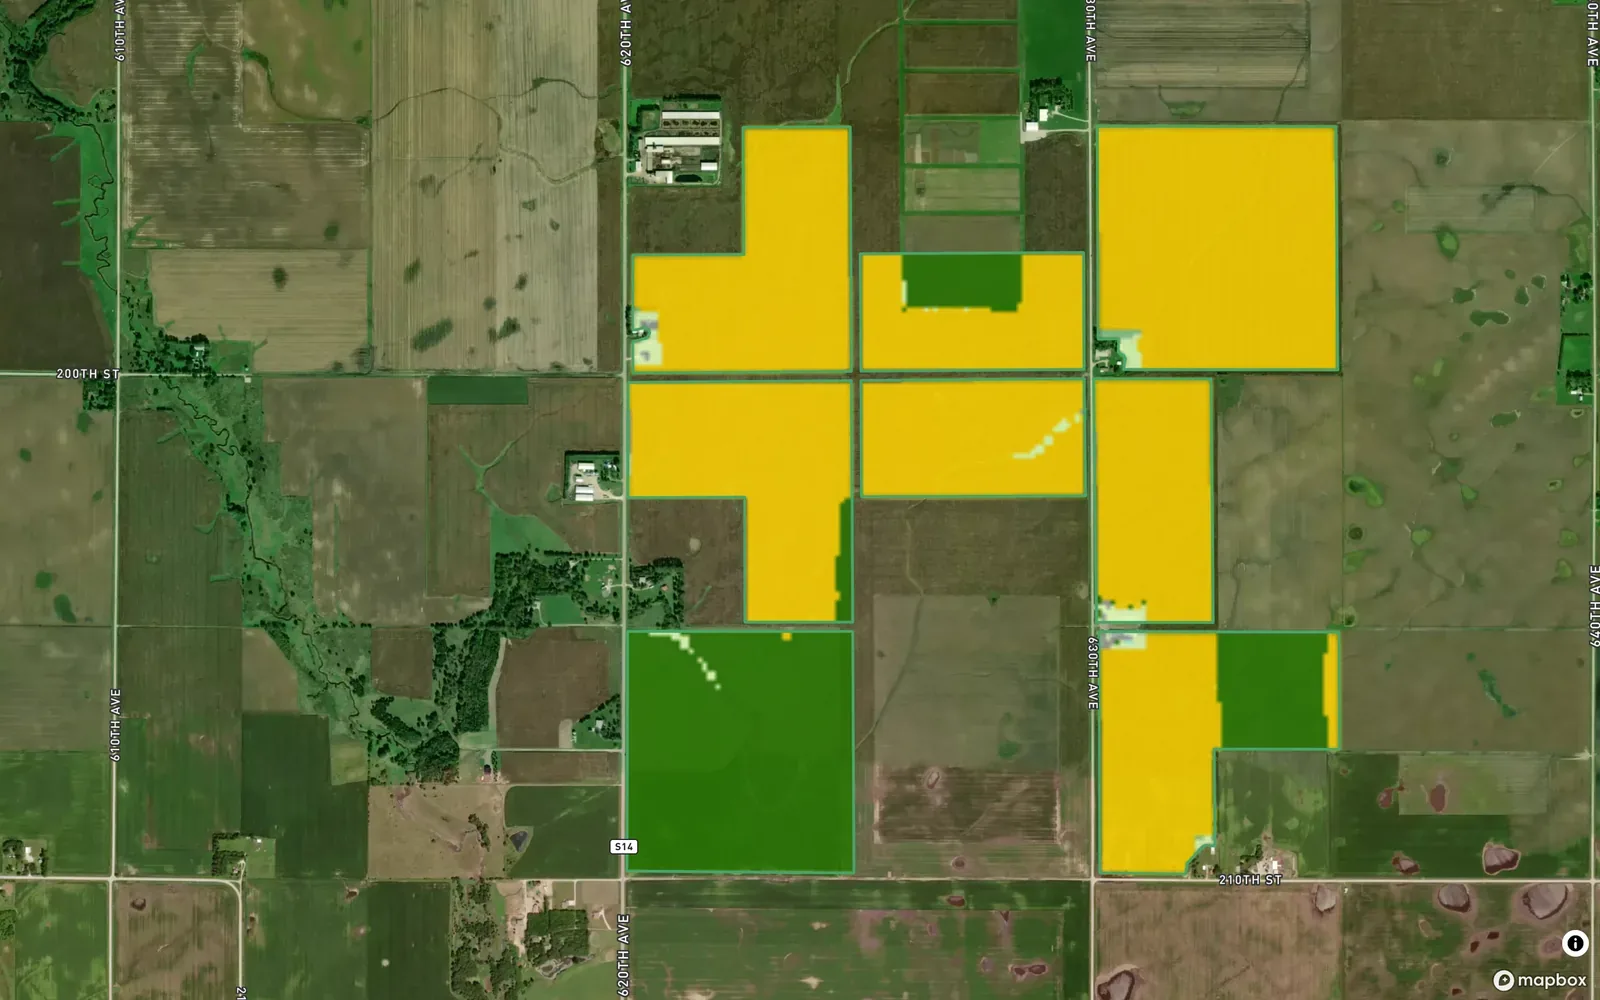

Example account: Prairie Agronomy
Formats, sources and availability
- Base maps
- Mapbox satellite, outdoors and light
- Boundaries in
- Shapefile, KML, KMZ, GeoJSON, or drawn on the map
- Layers
- NDVI (Sentinel-2), soil (USDA SSURGO), crop history (USDA NASS CDL), elevation, visit heat
- Coverage
- Maps, imagery and elevation worldwide. Soil and crop history for US fields
Who it’s for
Crop advisors and land managers can find a farm, return to a photographed stop and read its earlier visit notes. Agricultural layers add survey and satellite background when planning the walk.