
Skip to content

CropsCorn

Corn scouting, stand count to black layer

Corn scouting asks a different question at each stage (is the stand even, what is on the ear leaf, will it stand until harvest), and PropelMapper keeps each count with the spot in the field it came from.

Yield check - Home Place with its saved structured readings.
Example account: Prairie Agronomy.

Corn note and report

Yield check - Home PlaceSep 15, 2026

“Stand count 32,400 plants/ac across three 1/1000 ac checks, emergence fairly even.”

Example account: Prairie Agronomy

Visual example; transcript only.

Details in the noteFor review with the visit
  • Spoken stand count 32,400 plants/ac
  • Sampling method Three 1/1000 ac checks
  • Emergence Fairly even

Prairie Agronomy

Yield check - Home Place

Jorgensen Family Farms › Home Place (Corn)
Visit Sep 15, 2026 Version 1 · English
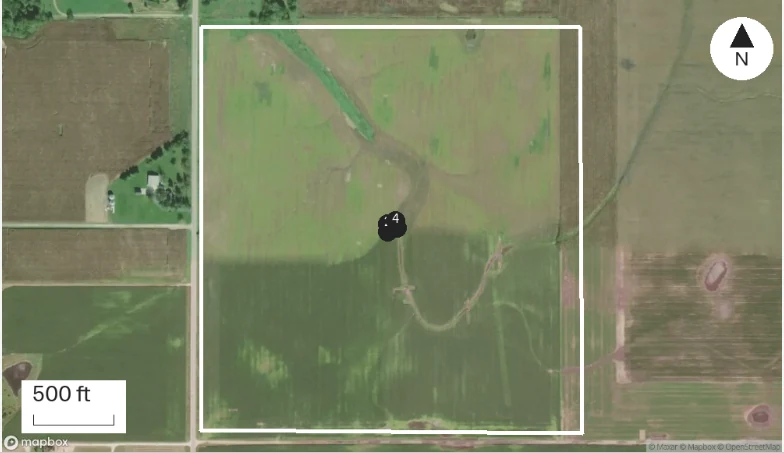
Home Place (Corn): captured report map with numbered observation pins and the saved boundary.
Numbered pins: visit captures · Dashed line: walked path · Basemap: Mapbox satellite. Imagery date not stated.

At a glance

  1. Stand count 32,400 plants/ac across three 1/1000 ac checks, emergence fairly even.

  2. Gray leaf spot lesions on the third leaf below the ear, maybe 5% of plants.

  3. Tar spot stromata found on two leaves near the waterway, first find this year.
Sources

  • Recorded on Sep 15, 2026 at Home Place (Corn).

Yield check - Home Place, Sep 15, 2026: “Stand count 32,400 plants/ac across three 1/1000 ac checks, emergence fairly even.” The visit form gets Spoken stand count 32,400 plants/ac, Sampling method Three 1/1000 ac checks, Emergence Fairly even, and the report lists them under Yield check - Home Place.

Example voice note and reviewed report

Corn visits on the map

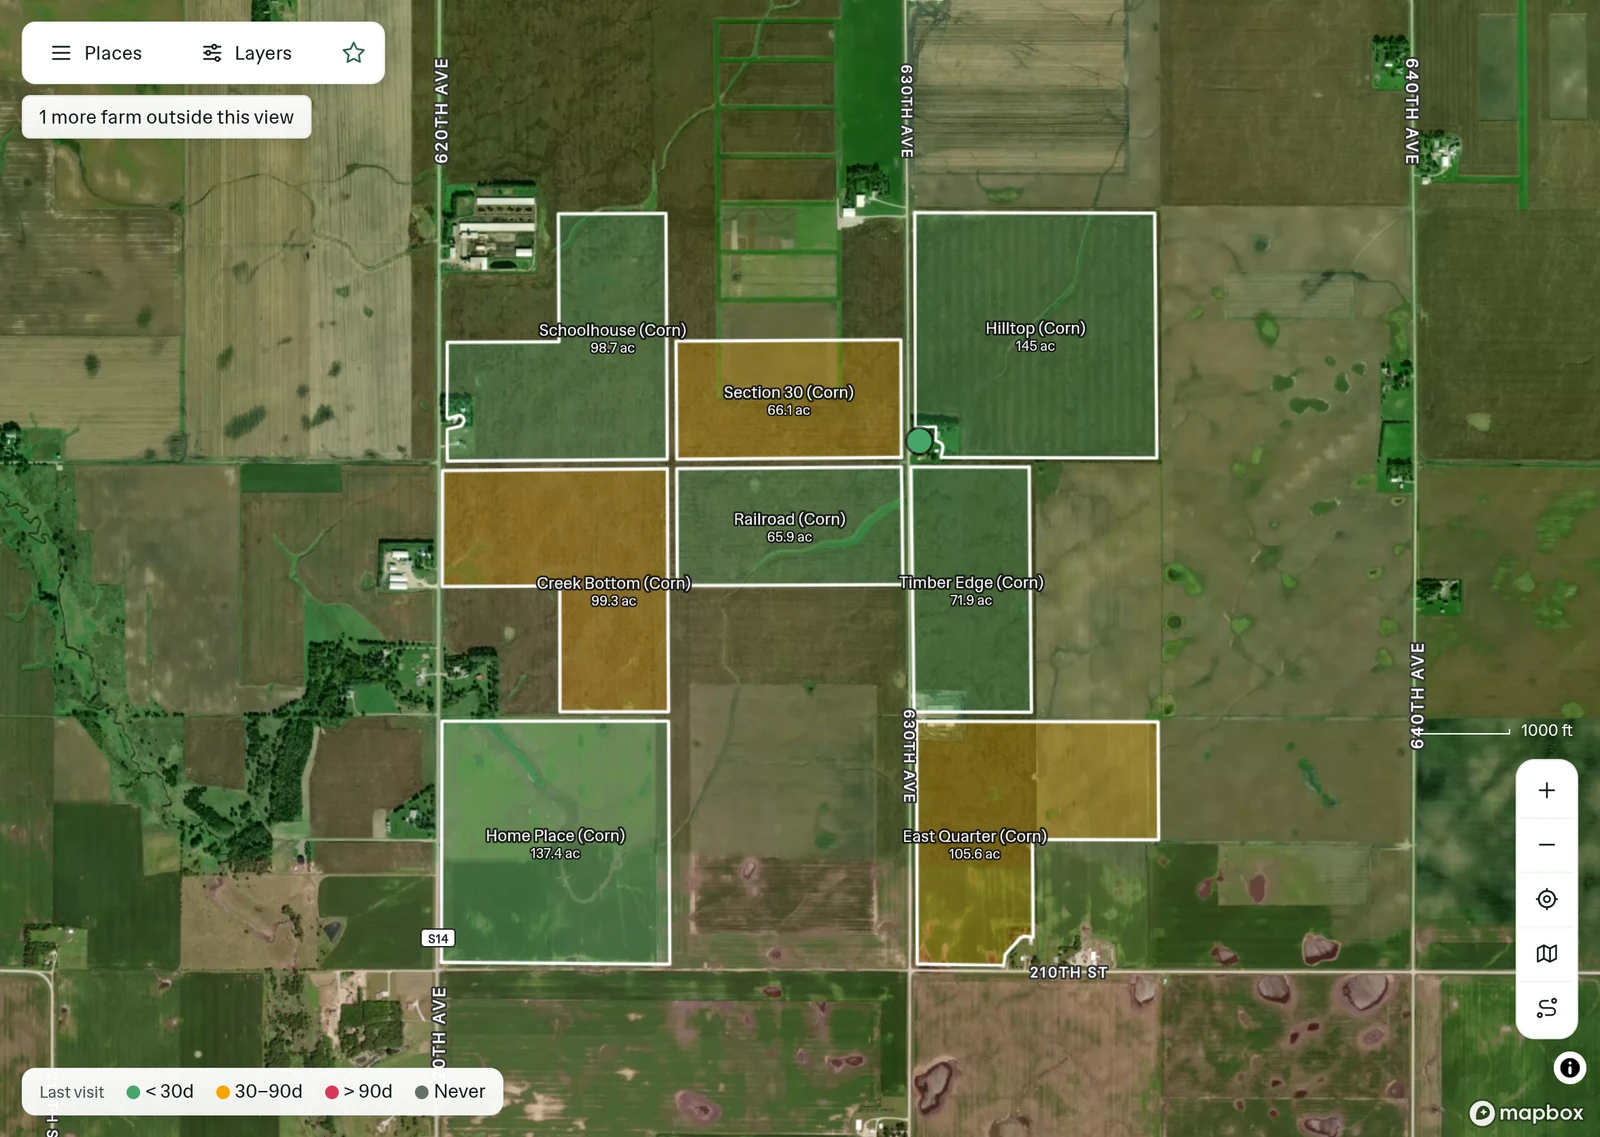
Prairie Agronomy on the Map: places outlined on satellite and colored by last visit.
Example account: Prairie Agronomy. Jorgensen Family Farms outlined on satellite and colored by last visit.

Corn places and hierarchy

Farm: Jorgensen Family Farms → Field: Home Place (Corn)

Saved places for Home Place (Corn).
Jorgensen Family Farms in the Prairie Agronomy place list, with its last visit and report status.

Corn signed report excerpt

Signed Yield check - Home Place findings for Home Place (Corn).
Example account: Prairie Agronomy. Excerpt from the signed report for Home Place (Corn).
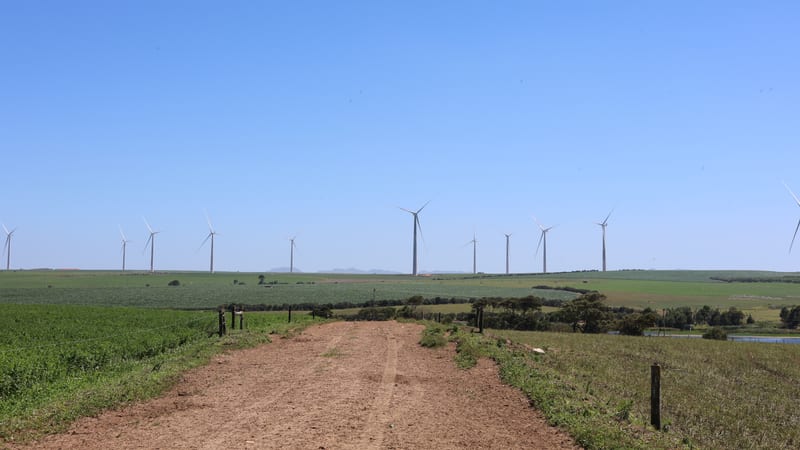
A dirt field track between green crops, with wind turbines along the horizon.
Corn · field guide
Stages
Leaf collars, then silking to black layer
CDL class
1 · Corn (12 · Sweet corn)
Scouting
Emergence through black layer

Stages follow the leaf-collar system described by University of Minnesota Extension. Acreage on this page is from the USDA Cropland Data Layer for 2025.

A dirt field track between green crops, with wind turbines along the horizon.
Report out

The inspection question

Corn stand counts in a problem area

The grower calls because the low end of the field looks thin. You could walk in, do five counts and report the average. It is better to count the low end and the rest of the field as two areas, three or four counts each, and say so in the report. The grower asked about the low end.

In PropelMapper each count is a note with a pin, so the report shows where the low number came from and where the high one came from. Say the row width and the length you measured with the count, and the stand count lands in the visit form for you to confirm. A photo of the wet corner next to the number answers the next question before anyone asks it.

The grower gets two numbers and a map instead of one number and a guess, and next spring’s planting conversation starts from the pins.

Where it grows

Where corn is grown

The Cropland Data Layer classified about 97 million acres as corn in 2025, and five states hold more than half of them.

  1. Iowa13.5 million acres
  2. Illinois11.3 million acres
  3. Nebraska10.5 million acres
  4. Minnesota8.7 million acres
  5. South Dakota6.7 million acres
  6. Kansas6.6 million acres
97.1 million acres across the 48 states in our snapshot, 2025. These are acres classified from satellite imagery, not NASS planted-acreage estimates. Sweet corn is a separate class and is not included. Class 1 acres from the USDA NASS Cropland Data Layer, retrieved October 16, 2026.
The walk

Field checks

Corn scouting by growth stage

Vegetative stages count visible leaf collars, and the reproductive stages start at silking. Each row below is a reason to be in the field, with the reading that makes the visit worth writing down.

Corn scouting by growth stage: observation, sampling context and readings
ObservationSampling contextRecord
VE to V4The first few weeks after emergence Count the stand in several places and note gaps, doubles and late plants. Nebraska Extension counts the plants in 17.4 feet of 30-inch row, one thousandth of an acre, and multiplies by 1,000. Plants more than three leaf stages behind their neighbors rarely produce, so leave them out of the count. Plants per 1/1000 acre, row width, number of counts, late plants
V5 to V10Rapid growth, usually June Collar stage on the plants you checked, weed escapes by species and height, early leaf disease, and nitrogen color. Pin the patch instead of folding it into the field average. Stage, weed species and height, symptoms with location
VT to R2Tassel, silk and blister Silks and pollination, rootworm beetles on silks, and leaf disease on the ear leaf and above. Tar spot shows as raised, black stromata that do not rub off; the Crop Protection Network overview shows what else it can be confused with. Ear-leaf severity, beetles per plant, stage
R3 to R6Milk to black layer Ear and kernel counts for a yield estimate, stalk strength and lodging by area, ear rots, and grain moisture as harvest nears. Ears per 1/1000 acre, kernel rows and length, stalk test results, moisture

These are prompts for the record, not treatment thresholds. Use your state’s current guidance for the management decision.

Corn crop history, NDVI and soil maps

Map layers stop at your field boundaries. They help you decide where to walk; they do not count plants.

  • Crop historyUSDA NASS Cropland Data Layer

    • Corn class 1
    • Sweet corn class 12

    Crop history shows the USDA class for each of the last eight years, so corn-on-corn ground is visible before you walk it. It is a classification, so check it against the grower’s records before you rely on it.

  • NDVICopernicus Sentinel-2 L2A

    Field mean, minimum and maximum

    A low-NDVI patch in July is a place to walk to, not a diagnosis. Check the image date against your visit date before you compare them.

  • SoilUSDA NRCS SSURGO

    map units, by share of the field

    Soil survey map units show where the wetter, poorly drained soils are, which often explains a thin stand at the low end of a field. A map unit is not a soil test.

Crop history NDVI Soil maps Field maps and layer sources

Who scouts corn

Questions

Corn scouting questions

How many stand counts are enough?

Enough to represent each area you are reporting on. Nebraska Extension suggests counting in several places and averaging. If the field has a problem area, count it separately so the average does not hide it.

Does crop history prove the field was corn last year?

No. It is the USDA’s classification from satellite imagery. Check it against the grower’s records before you treat it as fact.

Can I scout corn with no signal?

Yes. Notes, photos, video and counts save on the phone and upload when you are back in range. The draft report is made after the upload.

Start a corn scouting record

Start with a stand count in two areas and keep going to black layer. By fall, the field’s season is one list of visits.

What do you write up after a visit?

Pick one and see the signed report PropelMapper drafts for it.