

CompareSpreadsheets
Spreadsheets vs PropelMapper for field readings
In a visit spreadsheet every reading is written twice and lands in a row with no location; PropelMapper keeps it on the visit and the field where you took it.

- Today
- Readings retyped at night into a row with no location
- With PropelMapper
- Readings confirmed on the visit, exported when you want them
Check the handoff
Where a visit spreadsheet loses detail
The workbook is rarely the problem. The trouble is the trip from the field to the cell.
- RetypingA stand count written on a pad or a phone gets typed into the sheet that evening. Each retype is a chance to swap two digits or put a value in the wrong row.Every visit
- No placeA row says “North 80”. It does not say which end, or where the count was taken, so nobody can walk back to the same spot next month.Next visit
- No contextA disease score on its own means little without the scale, the crop stage and the note that explains it. A client asking about it in August deserves more than the number.At the report
Side by side
The visit workbook next to PropelMapper
| Part of the job | Spreadsheets | With PropelMapper |
|---|---|---|
| Getting the number in | Written at the field, typed again later | Said or typed once, during the visit |
| Where it was taken | A field name in a cell | The field, with the GPS point of the capture |
| The note behind it | In another file, if anywhere | Linked to the voice note it came from |
| Photos | Not in the sheet | On the same visit, under the same field |
| Checking a value | Ask whoever typed it | Open the visit and listen |
| Trends over a season | Formulas you maintain | The Metrics table, by farm, field and date |
| Your own analysis | Already in Excel | Export the Metrics table to CSV or Excel |
What changes
Recording field readings at the field
In PropelMapper you say a reading out loud or type it while you are standing in the field. When the visit uploads, readings in the recording come out as values for you to confirm. Each one is filed under the farm, the field and the date, with a link back to the voice note.
The Metrics table gathers those readings across every visit, and keeps their history. Export it to CSV or Excel and run your formulas as before. When a number in the workbook looks odd, open the visit it came from instead of asking around.
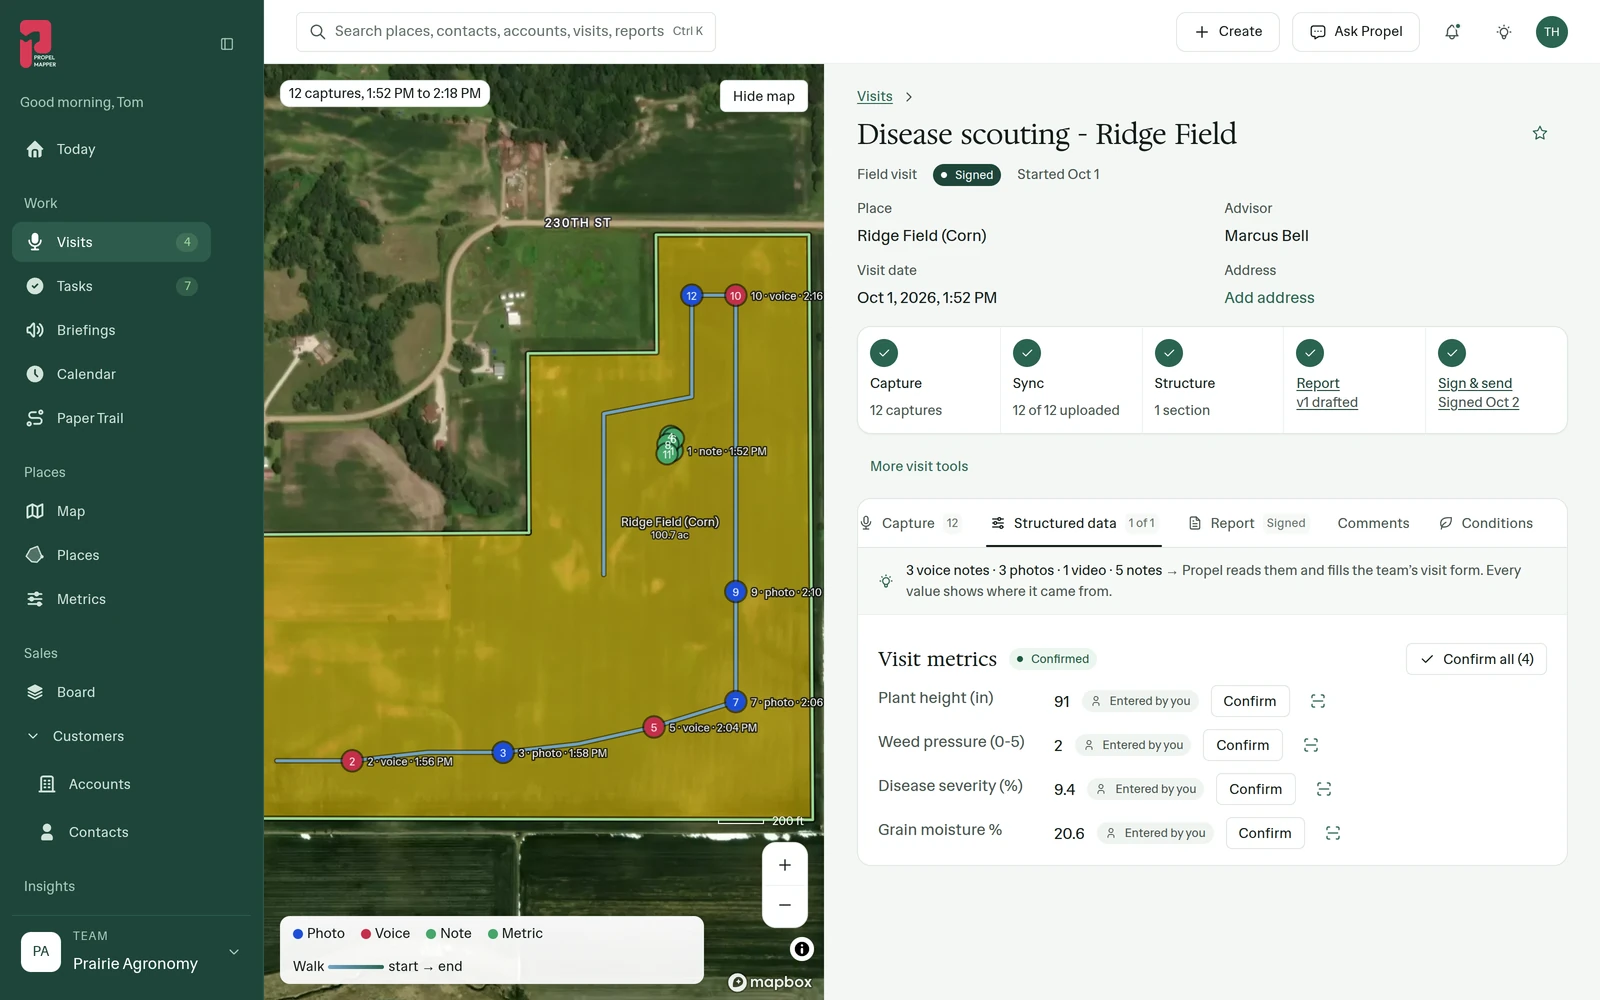
Example account: Prairie Agronomy
 The visit
How you do it today
What a visit spreadsheet does well
Spreadsheets earn their place. Your formulas, pivot tables and charts are built the way your team thinks about a season, and everyone already knows how to open the file.
We are not asking anyone to give that up. The change is upstream: how numbers reach the workbook, and whether each one can still be traced to a spot in a field.
- Your formulasCalculations your team trusts, built over years.
- Everyone can open itNo training, no new login, no account to set up.
- Analysis your wayPivot tables and charts shaped to the question you are asking.
Customer experience
“The ability to recall everything about everything is really difficult. And so now I can just pop open and look at the metrics tab and say, okay, where was I at when I checked this in the spring?”
 Jim G.Farm Manager, Peoples Company
Questions
Questions from spreadsheet users
Can I keep using Excel?
Yes. Export the Metrics table to CSV or Excel whenever you want, and keep your formulas and charts in the workbook.
Which readings can PropelMapper track?
The ones your team defines: stand counts, insect counts, disease scores, moisture, plant height and so on. You set up metric types, with alternate names, and readings from each visit fill them in.
Can I bring in last season’s spreadsheet?
Places and field boundaries import from CSV, KML, KMZ, GeoJSON or a zipped shapefile, up to 20 MB. For past readings, talk to us when you start and we will look at your file.
Do I still check the numbers?
Yes. A value taken from a recording waits for you to confirm it, and you can open the voice note it came from.
End of the walk
Try a visit without retyping readings
Record your next visit, confirm the readings, export them, and paste them into your workbook. Then decide.